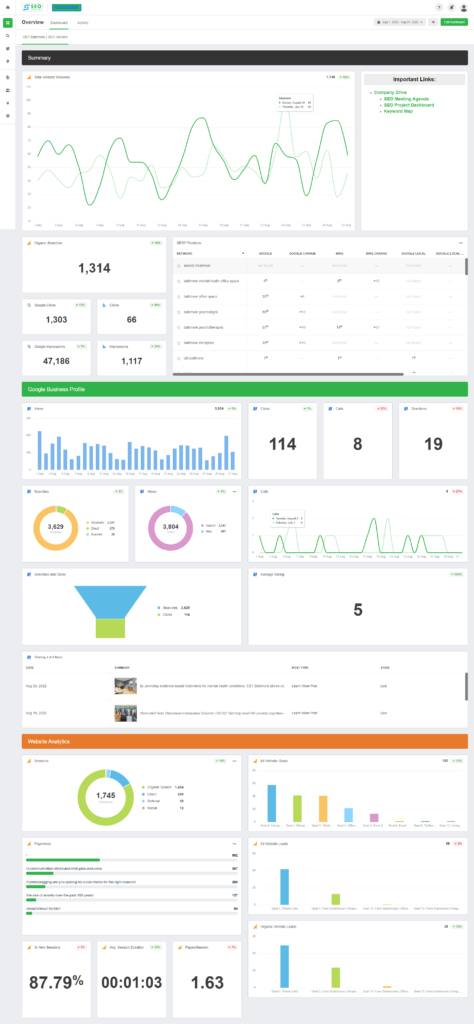
We currently offer dashboarding as an al la carte service. However, dashboarding is included with all of our SEO and paid media campaigns.
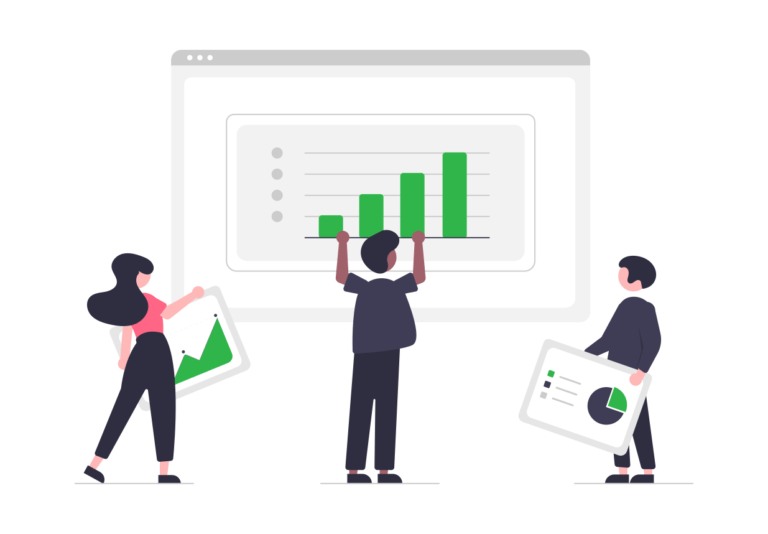
Dashboarding is the practice of creating data visualizations from various 3rd party sources in order to illustrate digital business KPIs.
Welcome to the future of data analysis. Here at SEO Succor, we understand that data alone isn’t enough. That’s why we leverage the power of state-of-the-art data visualization to transform complex datasets into intuitive, understandable, and actionable insights.
Our data visualization services empower your business to make data-driven decisions confidently. We convert your raw data into powerful visuals, helping you to identify patterns, trends, and insights that might otherwise be overlooked.
Whether it’s understanding customer behavior, tracking campaign performance, or analyzing market trends, our data visualization solutions provide the clarity you need to make informed strategic decisions.
We utilize leading-edge data visualization tools and technologies, such as Looker Studio, Power BI, and Agency Analytics, among others. Our team of data experts is skilled in crafting comprehensive, interactive, and easy-to-understand data visualizations.
Whether it’s interactive dashboards, infographics, or advanced reporting, we’ve got you covered.
We understand that every business is unique, and so are its data needs. Our data visualization services are customized to align with your specific objectives and requirements. We work closely with you to understand your goals, allowing us to craft tailored data visualization strategies that drive tangible results.
Our mission is to make data accessible and understandable for everyone in your organization. We present your data in a visually engaging manner that encourages exploration and promotes understanding.
With our data visualization solutions, every team member can dive into the data, uncover insights, and contribute to your business’s growth.
Data visualization is more than just beautiful charts and graphs. It’s about illuminating the hidden gems within your data and transforming them into actionable insights.
By visually representing your data, we help you uncover opportunities for growth, streamline operations, enhance customer experience, and ultimately, drive business performance.
Ready to unlock the true potential of your data? Get in touch with us today. Let’s embark on a journey to make your data more understandable, more accessible, and more valuable than ever before.
Learn more about our dashboarding and web analytics services.
Schedule a complimentary consultation with one of our analytics experts.